

A service of Scott P. Rogers, Associate Broker, Funkhouser Real Estate Group 540.578.0102 | scott@HarrisonburgHousingToday.com
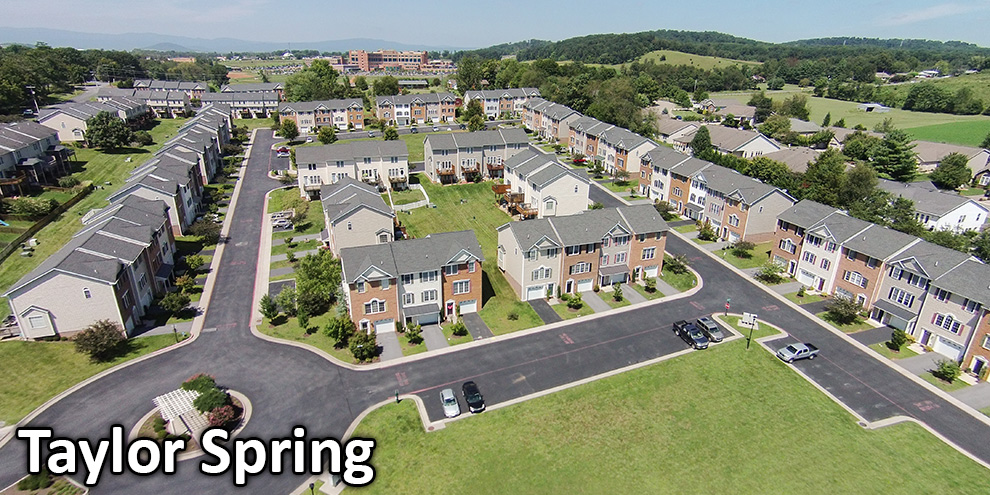
TAYLOR SPRING
Taylor Spring • The Townes at Bluestone
Sales Per Year....
| 2026 | 1 (ytd) | |
| 2025 |

|
7 |
| 2024 |
|
9 |
| 2023 |
|
10 |
| 2022 |
|
6 |
| 2021 |
|
16 |
| 2020 |
|
21 |
Median Sales Price....
| 2026 |

|
$299,000 |
| 2025 |
|
$299,700 |
| 2024 |
|
$290,000 |
| 2023 |
|
$287,750 |
| 2022 |
|
$272,950 |
| 2021 |
|
$245,750 |
| 2020 |
|
$219,000 |
Sample Taylor Spring Investment Analysis....
| Property Details | ||
| Purchase Price | $299,350 | based on median sales price |
| Income (Annual) | ||
| Monthly Rental Rate | $1,700 | estimate based on currently available rental data |
| Projected Vacancy | 4% | half a month per year |
| Gross Operating Income | $19,584 | |
| Expense (Annual) | ||
| Real Estate Taxes | $2,694 | estimate based on median sales price |
| Repairs | $850 | estimate based on typical property condition |
| Association Dues | $660 | estimated to be $55 per month |
| Property Management | $0 | assuming self management |
| Insurance | $1,078 | estimate based on recent trends |
| Utilities | $0 | assumes tenant pays all utilities |
| Advertising | $100 | estimate |
| Total Operating Expenses | $5,382 | |
| Cash Flow Before Tax | ||
| Gross Operating Income | $19,584 | |
| - Operating Expenses | - $5,382 | |
| Net Operating Income | $14,202 | |
| - Annual Debt Service | - $20,352 | financing 80% of the purchase price at 7.75% |
| Cash Flow Before Taxes | $-6,150 | |
Sales in the Past 36 Months....
Current Listings....
There are no properties on the market right now!
Neighborhood Map....