

A service of Scott P. Rogers, Associate Broker, Funkhouser Real Estate Group 540.578.0102 | scott@HarrisonburgHousingToday.com
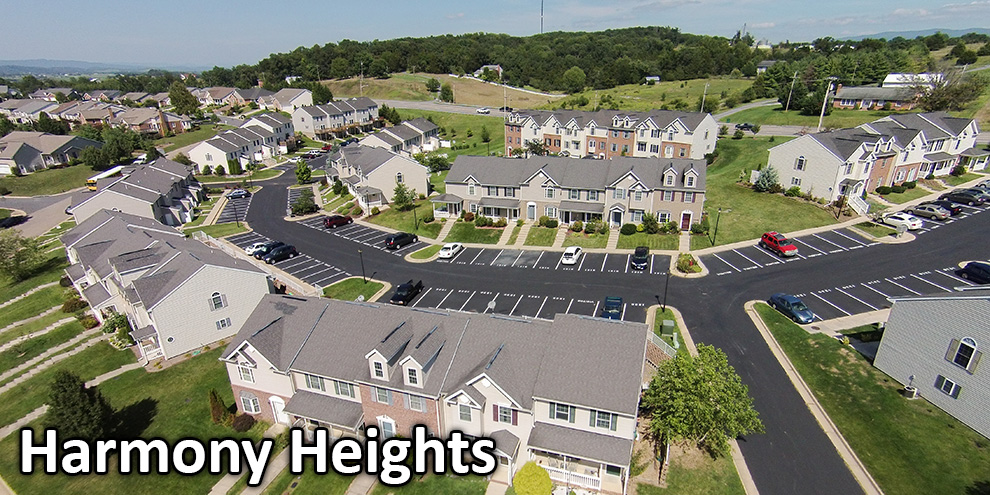
HARMONY HEIGHTS
Avalon Woods • Beacon Hill Townes • Harmony Heights • Liberty Square
Sales Per Year....
| 2026 | 0 (ytd) | |
| 2025 |

|
6 |
| 2024 |
|
5 |
| 2023 |
|
7 |
| 2022 |
|
9 |
| 2021 |
|
9 |
| 2020 |
|
9 |
Median Sales Price....
| 2026 | $0 | |
| 2025 |

|
$357,500 |
| 2024 |
|
$324,900 |
| 2023 |
|
$240,000 |
| 2022 |
|
$295,000 |
| 2021 |
|
$213,000 |
| 2020 |
|
$188,500 |
Sample Harmony Heights Investment Analysis....
| Property Details | ||
| Purchase Price | $360,000 | based on median sales price |
| Income (Annual) | ||
| Monthly Rental Rate | $1,300 | estimate based on currently available rental data |
| Projected Vacancy | 4% | half a month per year |
| Gross Operating Income | $14,976 | |
| Expense (Annual) | ||
| Real Estate Taxes | $3,240 | estimate based on median sales price |
| Repairs | $650 | estimate based on typical property condition |
| Association Dues | $540 | estimated to be $45 per month |
| Property Management | $0 | assuming self management |
| Insurance | $1,296 | estimate based on recent trends |
| Utilities | $0 | assumes tenant pays all utilities |
| Advertising | $100 | estimate |
| Total Operating Expenses | $5,826 | |
| Cash Flow Before Tax | ||
| Gross Operating Income | $14,976 | |
| - Operating Expenses | - $5,826 | |
| Net Operating Income | $9,150 | |
| - Annual Debt Service | - $24,468 | financing 80% of the purchase price at 7.75% |
| Cash Flow Before Taxes | $-15,318 | |
Sales in the Past 36 Months....
Current Listings....
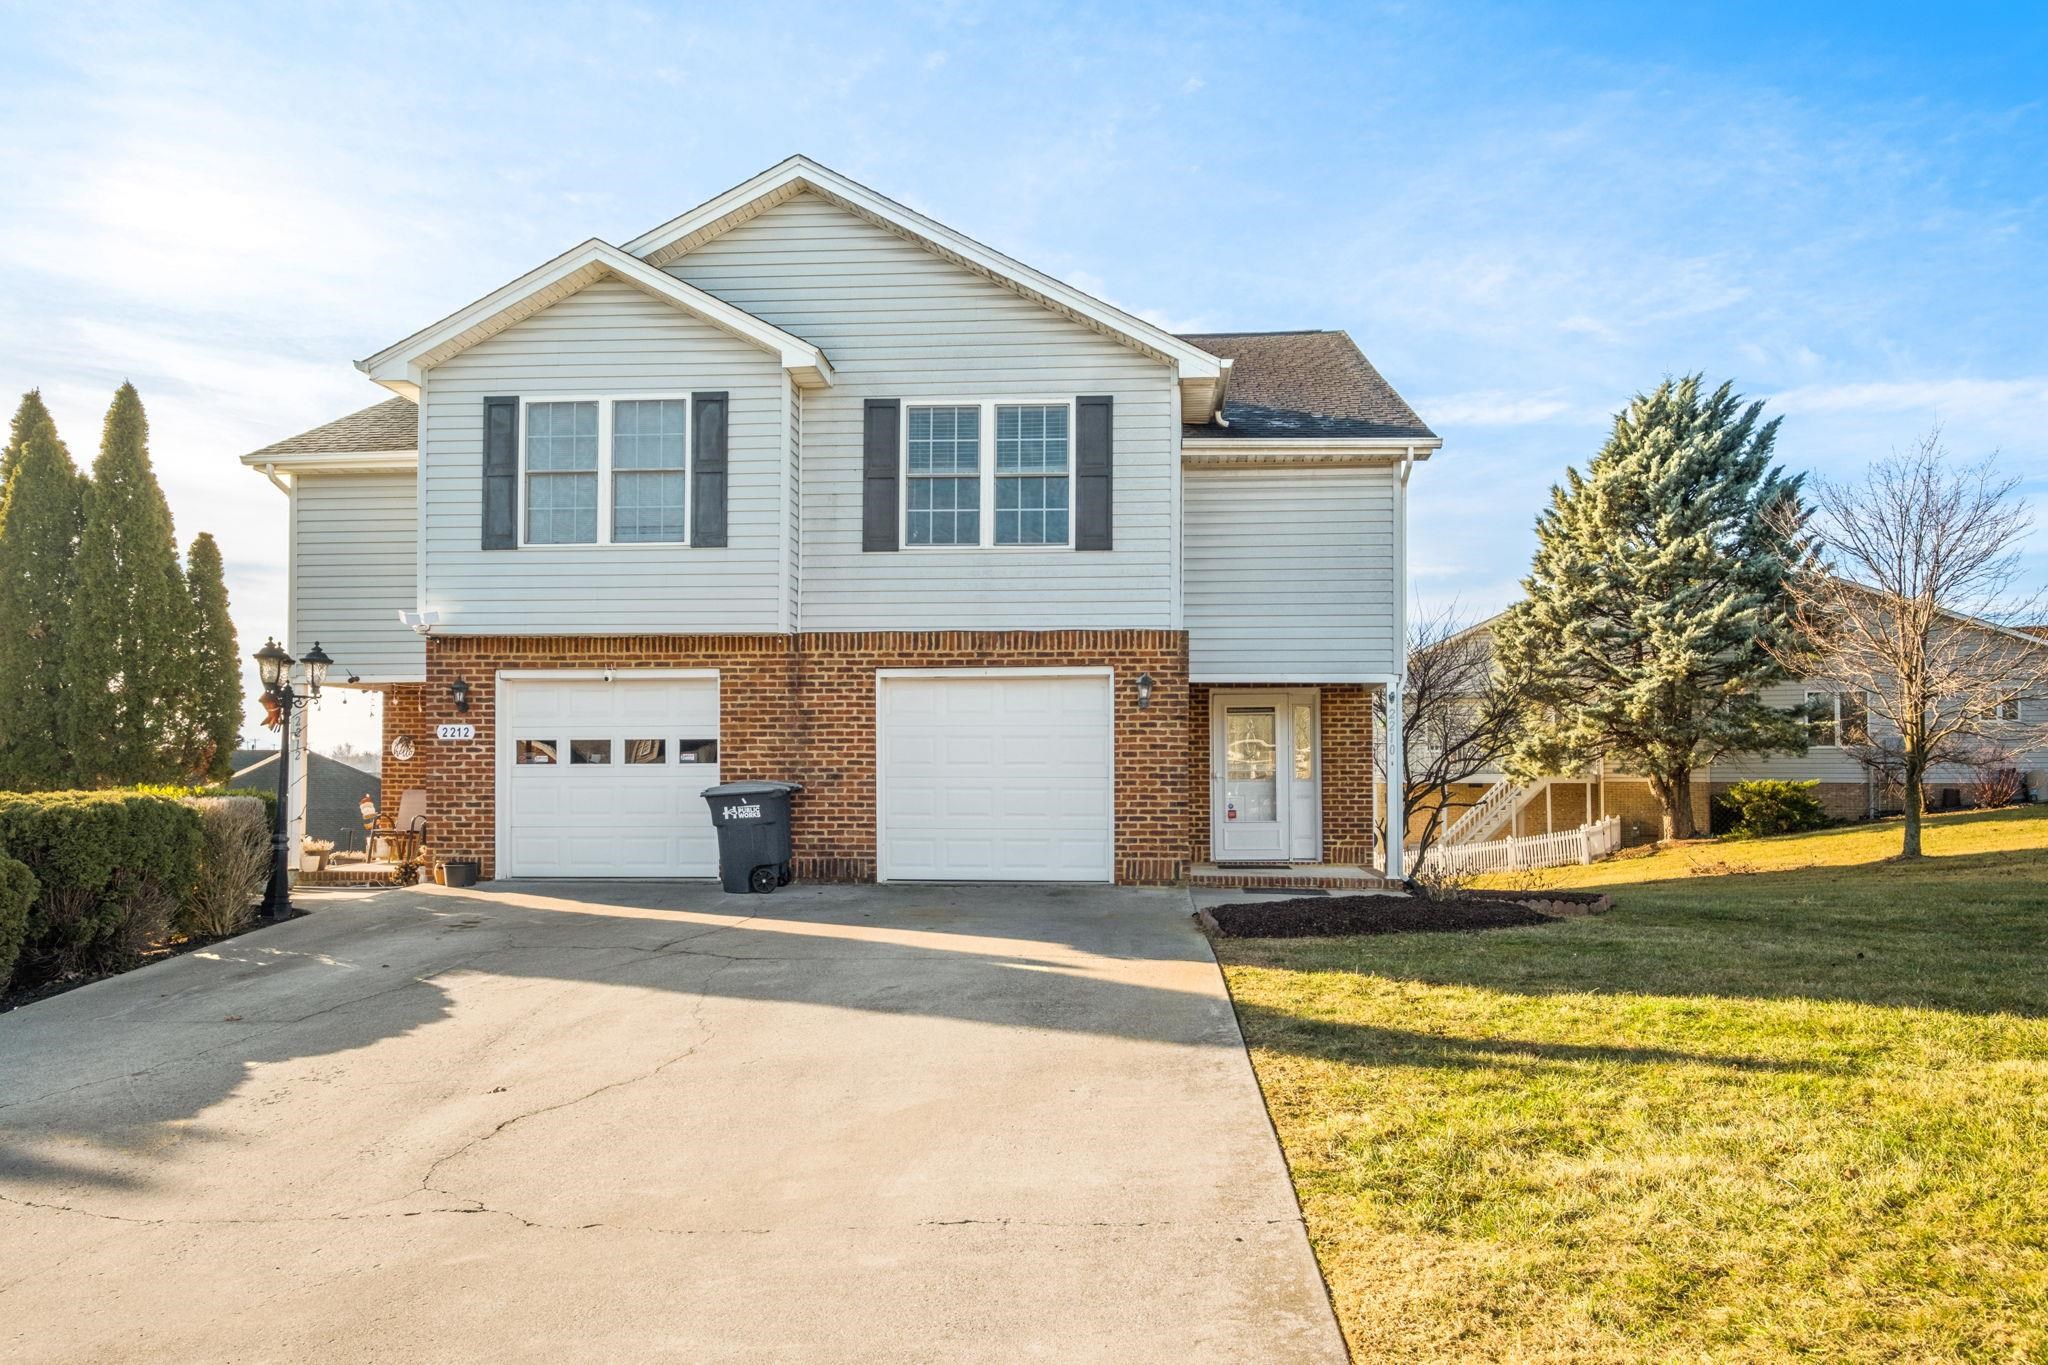
2210 Lake Terrace Dr
3 Beds • 2 Baths • 1 Half Baths
1,950 livable square feet
$350,000 (For Sale)
Listing By: RE/MAX Performance Realty
Neighborhood Map....